Adding GeoJSON Points to a Leaflet Map
Included in this tutorial:
Why use GeoJSON?
Loading a GeoJSON file of coordinates into Leaflet
How to Style your Markers
Software version in examples: Visual Studio Code (2025), Leaflet (1.9.4)
Tutorial Data: The tutorial includes demonstration with sample data available here.
Credits: Steven Dela Cruz Duncan & L. Meisterlin (2025)
In this tutorial, we'll learn how to plot points on a Leaflet web map using latitude and longitude coordinates from a GeoJSON file.
The dataset we are using, points1_table_join.json, is a GeoJSON version of the points1_table_join shapefile available in the Standard Data package. The coordinates are stored in the ‘geometry’ field as decimal degrees in WGS84. We’ll load this dataset and display markers on the map.
Related Tutorials:
Adding Points to the Map
Why use GeoJSON?
GeoJSON is a widely used format for encoding geographic data structures such as points, lines, and polygons. It is lightweight, human-readable, and easily integrates with web-based mapping libraries like Leaflet. Unlike shapefiles, GeoJSON files can be loaded dynamically in a web environment without requiring specialized GIS software. This makes them ideal for interactive maps where data needs to be updated or accessed in real time.
Load the GeoJSON Data
After setting up your Leaflet map (see Setting Up Your First Map in the Getting Started with Leaflet tutorial), let's load the GeoJSON file and add points to the map.
Add the following inside the <script> section right after initializing the map:
  // Load GeoJSON data from an external file
        fetch('points1_table_join.json') // Load the GeoJSON file
            .then(response => response.json()) // Convert response to JSON
            .then(data => {
                // Add GeoJSON layer to the map
                L.geoJSON(data, {
                    pointToLayer: function(feature, latlng) {
                        return L.circleMarker(latlng, {
                        }).bindPopup("<b>" + feature.properties.name + "</b>"); // Display name in popup
                    }
                }).addTo(map);
            })
            .catch(error => console.error('Error loading GeoJSON:', error)); // Handle errors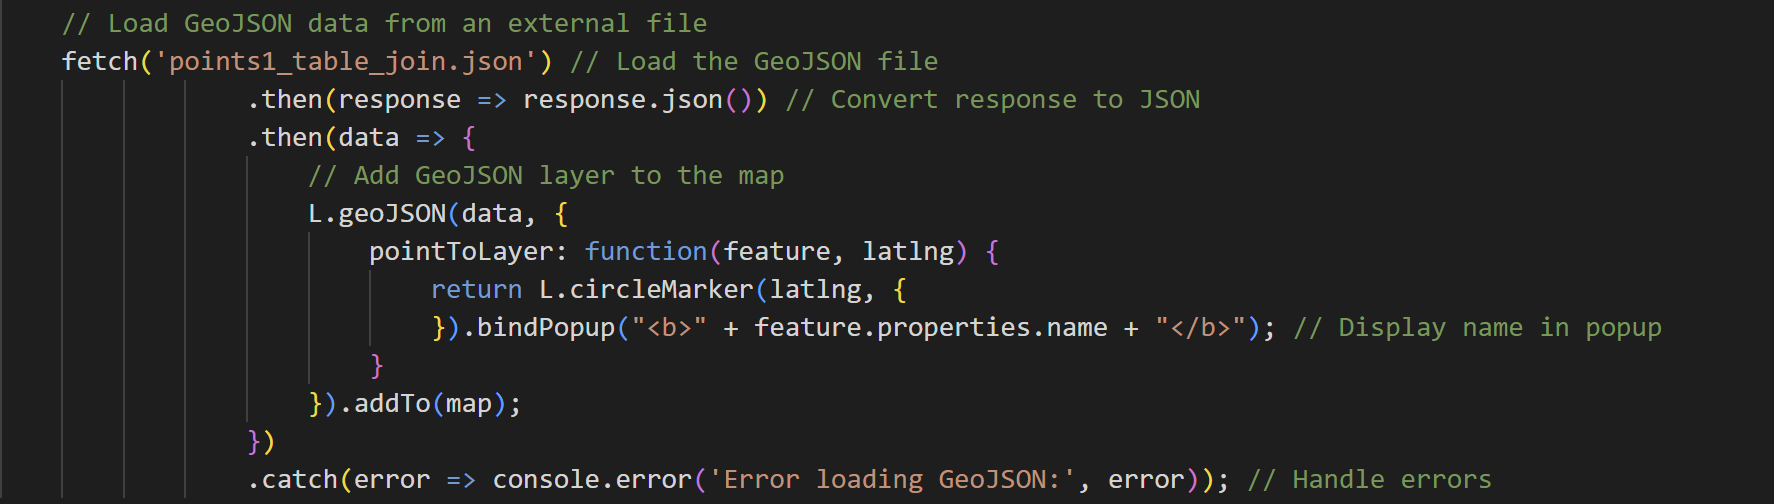
The map display after launching Live Server should look like this:
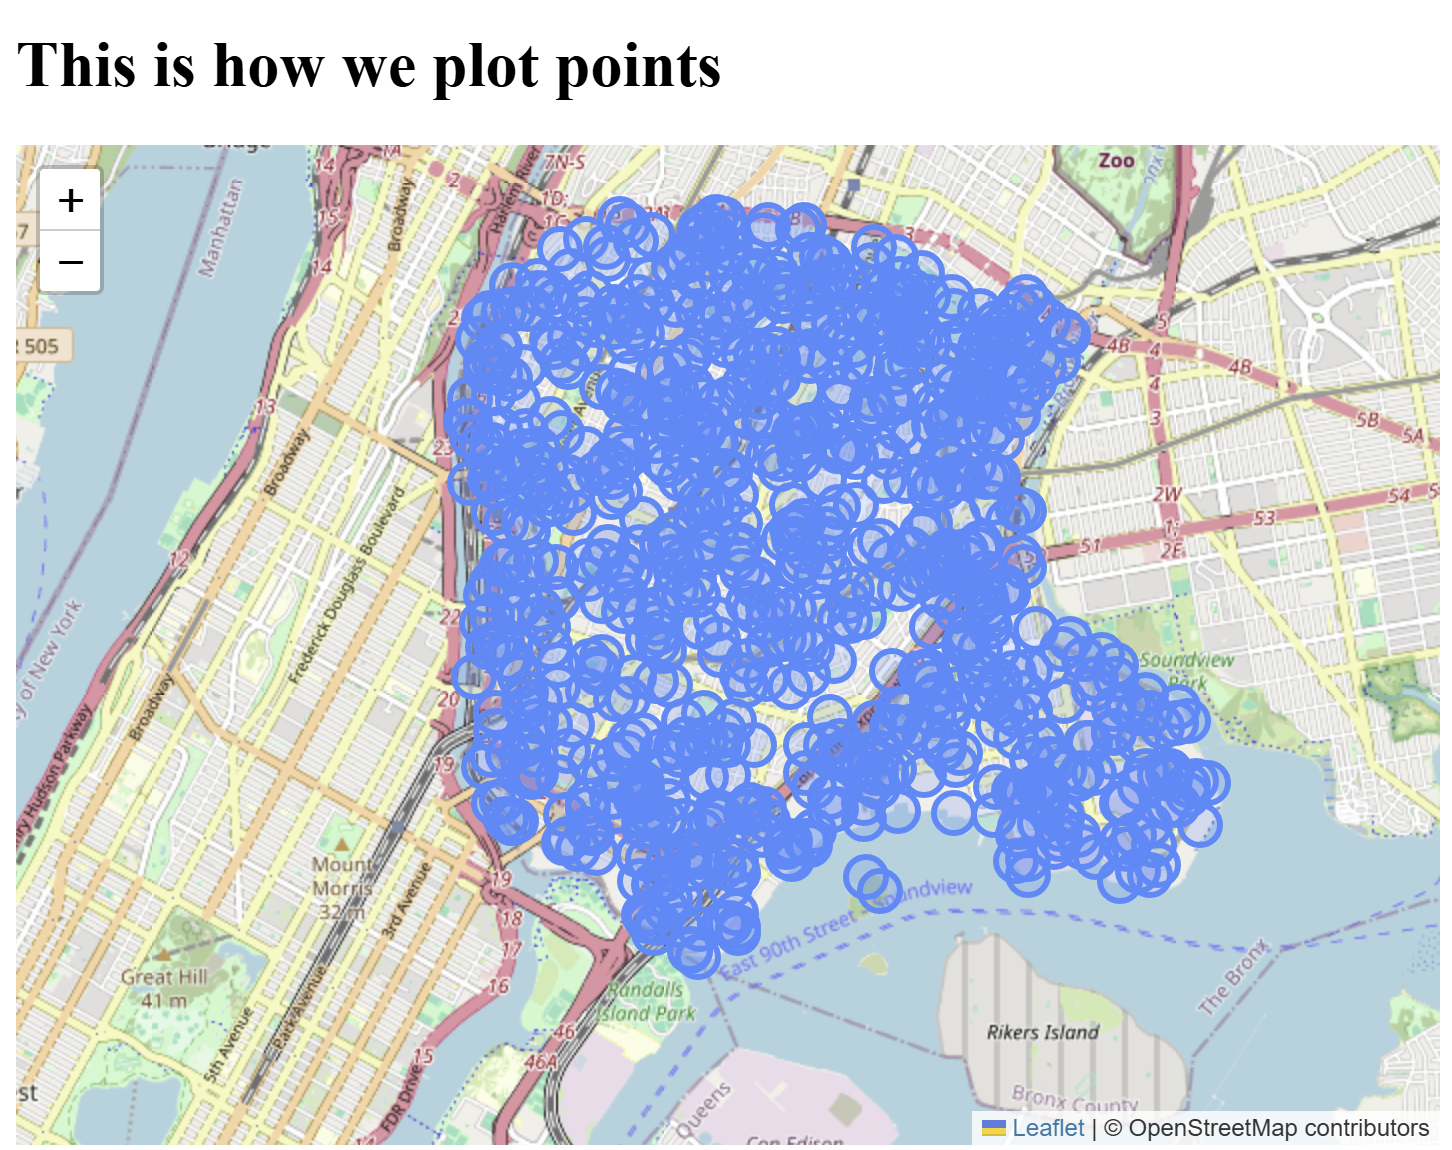
points added from GeoJSON
How to Style your Markers
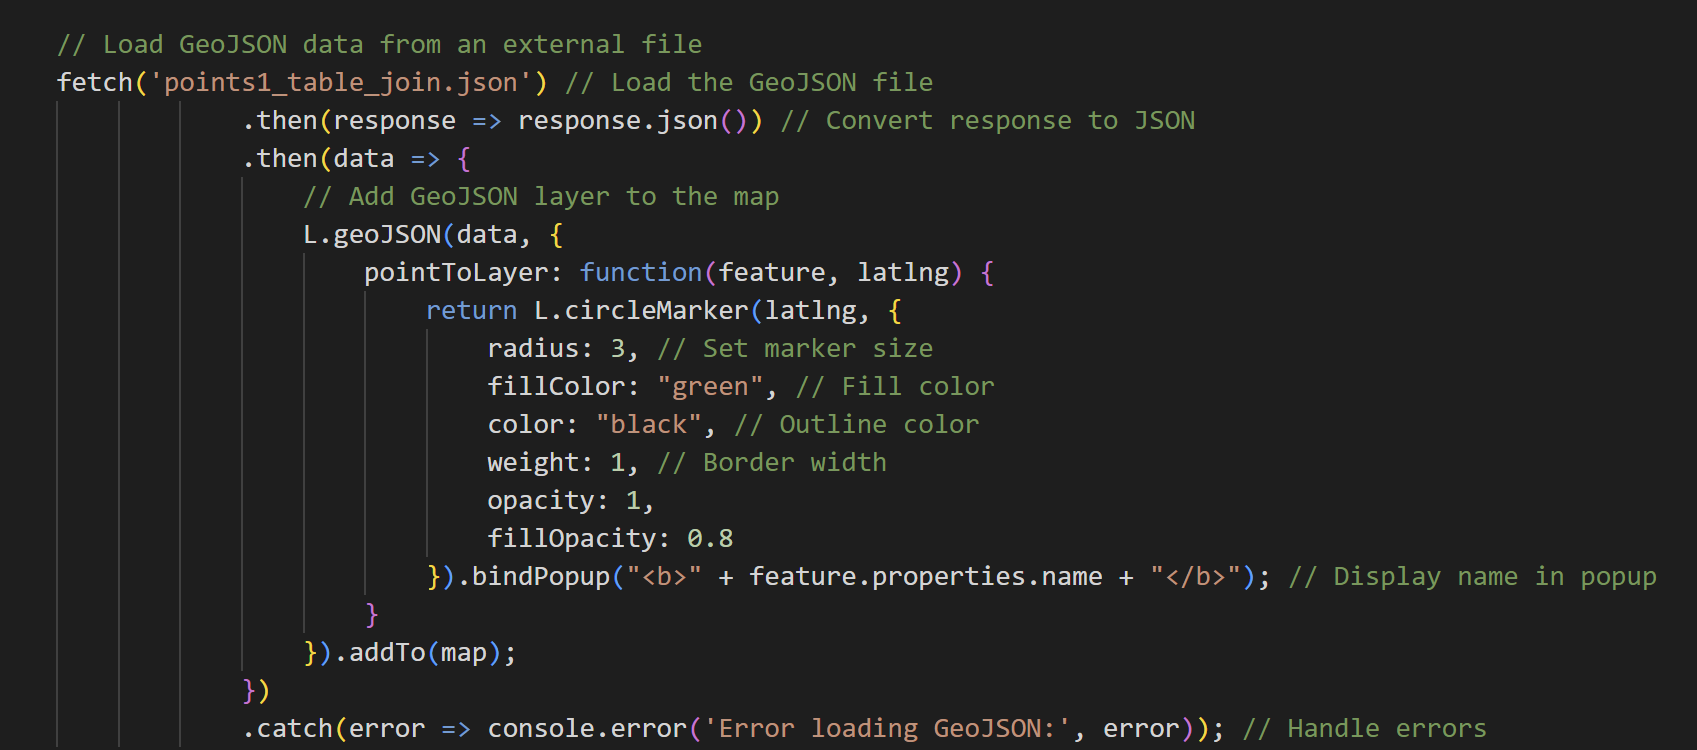
As an extra step, you can customize how your points look using simple coding syntax. For example, below, we set the marker (point) size, as well as other traits including colors and opacity.
 // Load GeoJSON data from an external file
        fetch('points1_table_join.json') // Load the GeoJSON file
            .then(response => response.json()) // Convert response to JSON
            .then(data => {

                // Add GeoJSON layer to the map

                L.geoJSON(data, {
                    pointToLayer: function(feature, latlng) {
                        return L.circleMarker(latlng, {
                            radius: 2, // Set marker size
                            fillColor: "green", // Fill color
                            color: "black", // Outline color
                            weight: 1, // Border width
                            opacity: 1,
                            fillOpacity: 0.8
                        }).bindPopup("<b>" + feature.properties.name + "</b>"); // Display name in popup
                    }
                }).addTo(map);
            })
            .catch(error => console.error('Error loading GeoJSON:', error)); // Handle errors
example point styling
The result of the styling example described above, with smaller green points with a black outline is pictured below.
Points with Style Attributes